

As building automation becomes more sophisticated, energy management tools have evolved to meet the growing demand for efficiency and control. One such powerful feature embedded in the Niagara 4 Vykon Pro platform is the Block Demand Calculator. This tool is a critical component for building managers, energy engineers, and systems integrators who seek to monitor and optimize energy consumption in real time.
also read: https://usaenliinea.com/san-xin-bing-zhan-zhuang-centros/
The Block Demand Calculator is designed to assist in tracking electrical demand within a specific time block, helping facility managers avoid costly demand charges and ensure energy is used efficiently. This article will explore how the Block Demand Calculator functions in the Niagara 4 Vykon Pro environment, its use cases, configuration process, and practical tips for leveraging its full potential.
What Is the Block Demand Calculator?
Overview of Demand Calculation
Electric utilities often impose demand charges based on the highest level of electrical usage during a specified period (typically 15 or 30 minutes). The Block Demand Calculator monitors this demand and calculates usage over defined time intervals, offering insight into when and where peaks occur.
In the Niagara 4 Vykon Pro system, this tool becomes part of a broader suite of building automation features, helping users manage HVAC systems, lighting, and more by responding to energy spikes with pre-programmed control strategies.
Key Features of Block Demand Calculator in Niagara 4 Vykon Pro
1. Custom Time Block Configuration
Users can define demand time blocks—such as 5, 15, or 30 minutes—depending on utility billing intervals. This allows for precise alignment with how energy providers calculate demand charges.
2. Real-Time and Historical Monitoring
The tool provides both live data and historical demand metrics. This helps in identifying trends, forecasting demand, and making informed energy policy decisions.
3. Integration with Control Logic
The calculator can trigger actions such as adjusting HVAC setpoints, dimming lights, or initiating load shedding when demand approaches critical levels.
4. Support for Multiple Inputs
Multiple load inputs can be monitored simultaneously, providing a holistic view of energy use across different systems or areas of a facility.
How It Works in the Niagara 4 Vykon Pro Environment
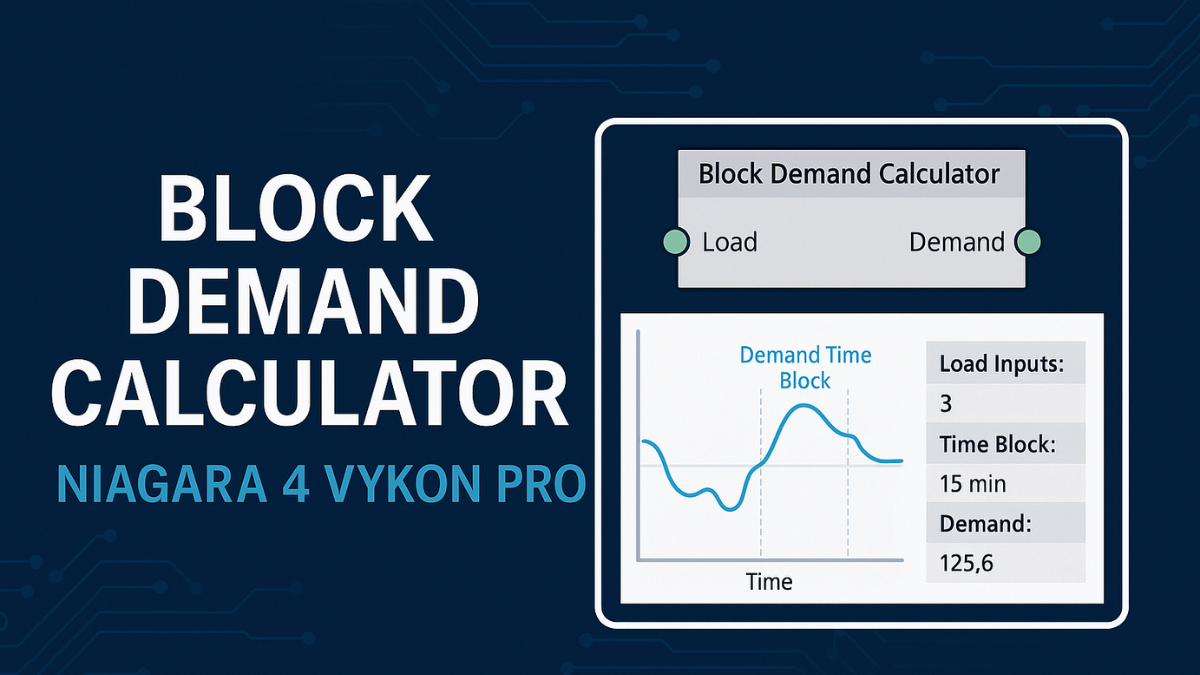
The Niagara 4 Vykon Pro platform is designed with interoperability in mind, allowing various devices and protocols to communicate within a unified system. The Block Demand Calculator fits into this ecosystem by acting as a logic block that receives power consumption data (typically from meters or sensors), processes it according to configured intervals, and outputs the demand value.
Here’s a simplified flow of how it operates:
1. Input Stage: Energy meters or sensors feed real-time consumption data into the Niagara system.
2. Calculation Logic: The block demand calculator processes this data over defined intervals to calculate average or peak demand.
3. Output & Action: The calculated demand can be logged, displayed on dashboards, or used to trigger automated control sequences.
Benefits of Using the Block Demand Calculator
Energy Efficiency
By pinpointing when energy spikes occur, users can modify behavior or schedules to flatten these peaks, resulting in substantial cost savings.
Cost Control
Many utilities charge based on peak demand rather than overall usage. Monitoring and reducing these peaks can significantly lower monthly bills.
Regulatory Compliance
Certain regions and industries are required to document or limit peak demand. The calculator supports compliance by providing detailed logs.
Predictive Maintenance
Analyzing historical demand trends can signal when systems are overworked, helping predict equipment failure and schedule maintenance before breakdowns occur.
Real-World Applications
1. Commercial Buildings
In large office buildings, the block demand calculator can help manage HVAC usage during high occupancy times, reducing overall electricity demand.
2. Manufacturing Facilities
Energy-intensive equipment can be scheduled strategically to avoid simultaneous operation, keeping demand within set limits.
3. Educational Institutions
Schools and universities benefit by reducing demand during peak hours, particularly when campus activity spikes at predictable times.
Configuring the Block Demand Calculator in Niagara 4 Vykon Pro
Setting up the calculator requires basic knowledge of Niagara’s Workbench interface. Here’s a simplified step-by-step guide:
| Step | Action | Description |
|---|---|---|
| 1 | Add Component | Drag the Block Demand Calculator from the component palette. |
| 2 | Configure Inputs | Link it to power meter data points. |
| 3 | Set Time Interval | Define the calculation block (e.g., 15 minutes). |
| 4 | Output Connections | Link the output to graphs, logs, or control logic. |
| 5 | Testing | Simulate loads to ensure correct demand readings. |
Comparing Demand Calculation with Other Energy Management Tools
| Feature | Block Demand Calculator | Energy Meters | Smart Thermostats |
|---|---|---|---|
| Calculates Peak Demand | ✔️ | ❌ | ❌ |
| Time Block Customization | ✔️ | ❌ | ❌ |
| Real-Time Load Adjustment | ✔️ | ❌ | ✔️ |
| Integration with Niagara 4 | ✔️ | Partial | Partial |
Tips for Maximizing the Block Demand Calculator’s Effectiveness
- Combine with Alarming: Set thresholds to trigger alarms when demand approaches the limit.
- Review Trends Weekly: Use historical data to adjust equipment schedules.
- Integrate with Scheduling Logic: Match energy use with occupancy or operational schedules.
- Train Staff: Ensure operational teams understand the impact of peak demand.
- Audit Devices Regularly: Unnecessary or outdated equipment might cause spikes.
FAQs About the Block Demand Calculator Niagara 4 Vykon Pro
1. Can the calculator handle multiple time blocks simultaneously?
No, it’s configured for one block interval at a time, but you can duplicate the component for comparison.
2. Is this tool compatible with third-party meters?
Yes, as long as they support standard protocols like BACnet, Modbus, or LonWorks.
3. Can I export the demand data to CSV or Excel?
Yes, Niagara allows data export from histories for reporting and analysis.
4. How does it affect real-time automation?
It helps trigger load reduction or shutdown sequences during peak loads.
5. Can I display the calculator output on custom dashboards?
Absolutely. Niagara’s HTML5 dashboards support real-time data display.
6. Is there a mobile interface for viewing demand values?
Yes, Niagara 4 supports mobile-friendly views via web browsers.
7. Can I use the calculator for gas or water usage?
Technically yes, if you input flow data, though it’s primarily for electrical demand.
8. Is Niagara 4 Vykon Pro cloud-compatible?
Yes, it can be integrated with cloud systems for remote analytics and control.
9. How often should the calculator settings be reviewed?
Review monthly or whenever your energy profile changes significantly.
10. Does it support load prediction or just historical demand?
While primarily historical, when integrated with analytics modules, it can assist in forecasting.
Conclusion
The Block Demand Calculator in Niagara 4 Vykon Pro is an invaluable tool for anyone aiming to streamline building energy performance, reduce demand charges, and maintain compliance with energy regulations. It not only calculates real-time and historical demand but also empowers users to respond proactively through automation. Whether you’re managing a commercial facility or an industrial plant, incorporating this tool into your building management system leads to smarter energy decisions, cost savings, and enhanced operational efficiency.
also read: https://usaenliinea.com/arc018/
also read: https://usaenliinea.com/iofbodies-com-ethics/
also read: https://usaenliinea.com/thehrwp/
also read: https://usaenliinea.com/sodziu/